(For higher resolution: SVG, PDF.)
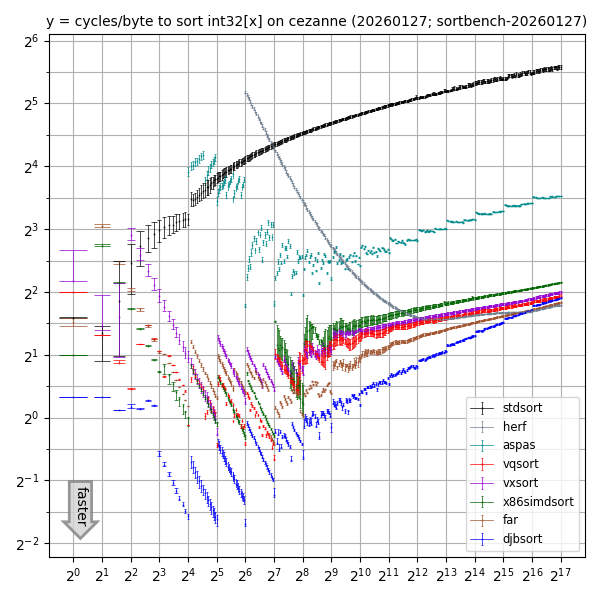
This graph compares sorting performance for various int32 array sizes
on one core of an AMD Ryzen 5 PRO 5650G
(2021 CPU launch; Zen 3 microarchitecture)
with overclocking disabled, Debian 12, gcc 12.2.0, clang 14.0.6
using the following libraries:
djbsort;
the vxsort library
used in Microsoft's .NET
starting in 2020;
the vqsort/highway library
introduced by Google;
the far library, which is the (sometimes faster) parent of vqsort;
and the x86simdsort library
introduced by Intel.
See also the separate
comparison page
for a comparison of library features beyond speed.
The far, vqsort, vxsort, and x86simdsort libraries use vectorized sorting networks for small lengths and vectorized quicksort for large lengths. Increasing the length cutoff and calling djbsort for the base case would improve the performance of those libraries not just for small lengths but also for large lengths. The point is that larger-length sorting uses smaller-length sorting as a subroutine. (Beware that combining code in this way would not achieve the security and verification of djbsort.)
There are also many slower sorting libraries.
The graph includes three of those for comparison:
"stdsort", which is std::sort from the installed C++ standard library;
"herf", which is radix-sorting code (with radix 2048) posted by Michael Herf in
2001
plus a simplification to sort int32 rather than float32;
and
"aspas",
from a 2018 paper
"A framework for the automatic vectorization of parallel sort on x86-based processors".
The herf and aspas results are shown only for array sizes at least 64 and 16 respectively,
since it is clear that std::sort is preferable for smaller arrays.
Note that Lukas Bergdoll reported in 2023
that "~50% of the time spent in slice::sort" in "clean compiling 60 crates"
was spent sorting arrays of
length at most 20.
It would be interesting to see more reports
on how the sorting time spent by applications
is distributed across array sizes and data types.
How were the numbers collected?
The graph relies on data from a small C++ benchmarking program, sortbench, used for all of the libraries. The program is run 8 times for each library (which should catch any frequent VIPT effects). Each run tries many array sizes, including powers of 2 but also many more sizes (which should catch slowdowns for inconvenient sizes). For each array size, each run
- generates an array with random contents;
- fills 64 arrays with random permutations of the first array;
- sorts each of those 64 arrays in turn with the tested library, checking the cycle counter after each sort; and
- checks that all of the supposedly sorted arrays match the output of
std::sort.
The 64 arrays are spaced by an odd number of integers, so most of them are not aligned to cache lines. (Applications might specifically align arrays to try to save time, so it would be useful to separately benchmark the aligned case.)
For each library at each size, the graph shows stabilized quartiles of the resulting 512 cycle-count measurements. The three quartiles are marked as horizontal line, small X, horizontal line. Measurements can vary (producing noticeable vertical distances between the horizontal lines) because of branch-prediction effects and other pipeline effects, or because of some sorting algorithms handling different permutations at different speeds. The benchmarking program does not try to find "bad" inputs.
The program collects cycle counts using libcpucycles, which on the machine mentioned above ends up using RDPMC to read an on-core cycle counter. The plotting script subtracts the observed cycle-counting overhead from every cycle count in the graph before drawing the graph.
Since CPUs typically support overclocking and typically have overclocking enabled by default (at the expense of security problems and decreased hardware longevity), it would also be useful to measure power consumption at various clock frequencies, and to measure time consumption when overclocking is enabled with specified numbers of cores active simultaneously. Enabling overclocking can produce different CPU frequencies for different libraries with different power consumption, changing the relative time for those libraries.
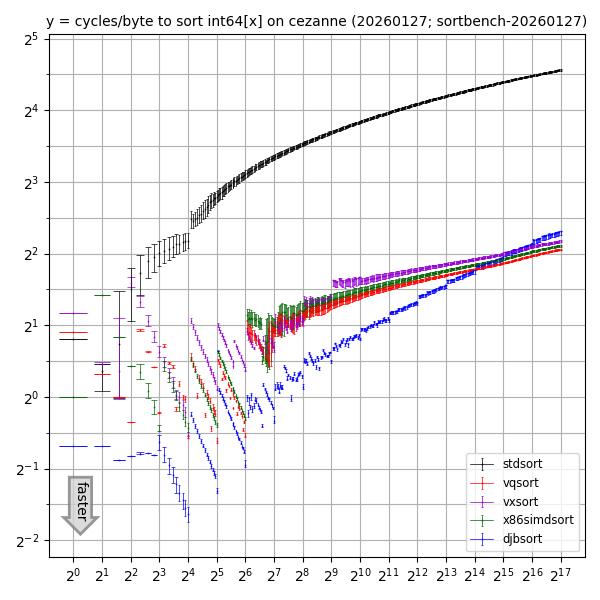
What about int64 arrays?
(For higher resolution: SVG, PDF.)
There are two reasons
that the speedup of vectorized libraries over std::sort for int64 arrays
is smaller than the speedup over std::sort for int32 arrays.
First, a 256-bit vector instruction carries out 8 int32 operations
but only 4 int64 operations.
Second,
the AVX2 instruction set has min and max instructions for int32x8 but not for int64x4.
What about other CPUs?
Here's one core of an Intel Xeon E3-1220 v5 (2015 CPU launch; Skylake microarchitecture) with Ubuntu 24.04, gcc 13.3.0, clang 18.1.3.
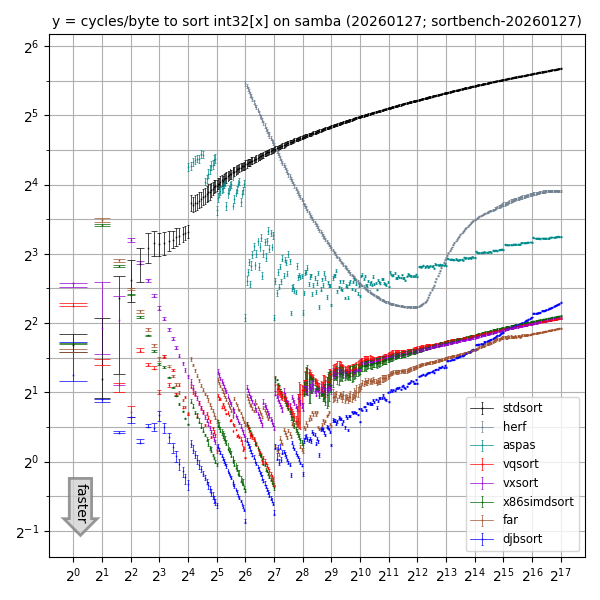
(For higher resolution: SVG, PDF.)
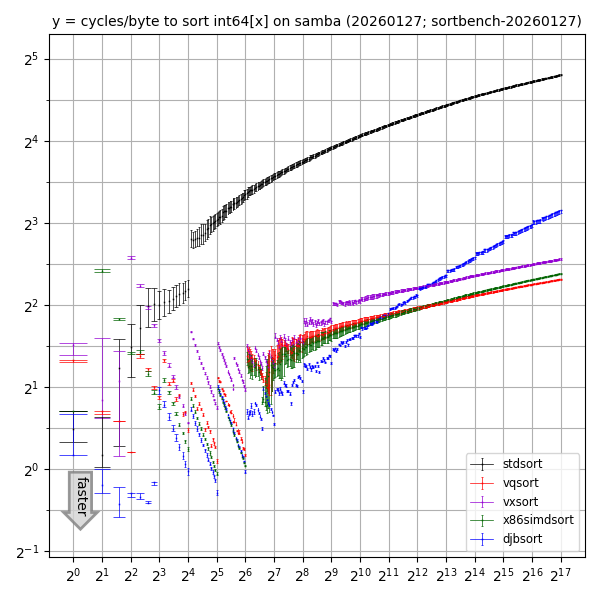
(For higher resolution: SVG, PDF.)
It would be useful to benchmark more CPUs. Some libraries obtain a speed boost from AVX-512 (although vxsort would need some lines to change in the sortbench program for AVX-512). Also, vqsort supports ARM NEON etc.
Running sortbench
Currently the sortbench tool supports only CPUs with AVX2, and has been tested only under Debian and Ubuntu. The tool needs the following system packages:
- gcc and other compiler tools:
apt install build-essential - clang:
apt install clang - for Ubuntu 22.04, missing C++ libraries:
apt install g++-12 - cmake:
apt install cmake - meson:
apt install meson - Python 3:
apt install python3 - matplotlib:
apt install python3-matplotlib - libcpucycles:
apt install libcpucycles-dev(or install directly from the source)
(Combined for Ubuntu 22.04:
apt install build-essential clang g++-12 cmake meson python3 python3-matplotlib and install libcpucycles from source.
Combined for Debian 12:
apt install build-essential clang cmake meson python3 python3-matplotlib and install libcpucycles from source.
Combined for Ubuntu 24.04 or Debian 13:
apt install build-essential clang cmake meson python3 python3-matplotlib libcpucycles-dev.)
The sortbench tool is included in the djbsort source distribution.
It is not
installed as part of a djbsort binary package
(and is not incorporated into the djbsort-speed utility).
So the next step is to
download and unpack djbsort
as an unprivileged user.
You still need a network connection after this for running the sortbench tool: the tool automatically downloads copies of the aspas, far, vqsort, vxsort, and x86simdsort libraries. The tool assumes you have already installed djbsort (as a home-directory installation or a system installation) and stdsort (as part of the standard C++ library). The tool includes a copy of the (very small) herf library.
Last step:
cd sortbench
./do
Results should end up in
plot32.pdf, plot32.svg, plot32.png,
plot64.pdf, plot64.svg, and plot64.png
in the sortbench directory.
The tool runs benchmarks on a single core
(while allowing whatever number of cores are used for compilation of the libraries).
The benchmarks typically take 10 to 20 minutes, depending on the core speed.
More time is taken by compilation, especially for vqsort,
but overall it is not surprising if ./do finishes in under an hour total.
If you re-run ./do then the libraries will not be recompiled
(unless you do rm */skiprebuild first)
but the benchmarks will be re-run.
This is useful if you have enabled
more reliable cycle counters
in the meantime.
One known failure mode in ./do is vqsort compilation running out of RAM.
If this happens, try taskset -c 0 ./do to limit everything to core 0.
If that still isn't enough, try adding some swap space.
(As root, to add 16GB of swap space until reboot:
mkdir /root/swap; chmod 700 /root/swap; dd if=/dev/zero of=/root/swap/tmp1 bs=16777216 count=1024; chmod 600 /root/swap/tmp1; mkswap /root/swap/tmp1; swapon /root/swap/tmp1.)
For CPUs with heterogeneous cores (such as P-cores and E-cores in many recent Intel CPUs), you should benchmark each type of core separately. For example,
taskset -c 0-3 ./do
mkdir threads0-3
mv plot*.* threads0-3
taskset -c 4-7 ./do
mkdir threads4-7
mv plot*.* threads4-7
will limit benchmarks to OS threads 0–3 first, then to OS threads 4–7.
There is no standard mechanism to figure out the partition of threads into core types, but
grep . /sys/devices/system/cpu/cpu*/cache/index*/size
usually makes the patterns clear.
Version: This is version 2026.01.27 of the "Speed" web page.